SLA status & breach
Every Quartz SLA goal resolves to one status — from on track through at risk to breached — derived live from the issue's timeline so you always see where a promise stands and what is about to slip.
The status spine
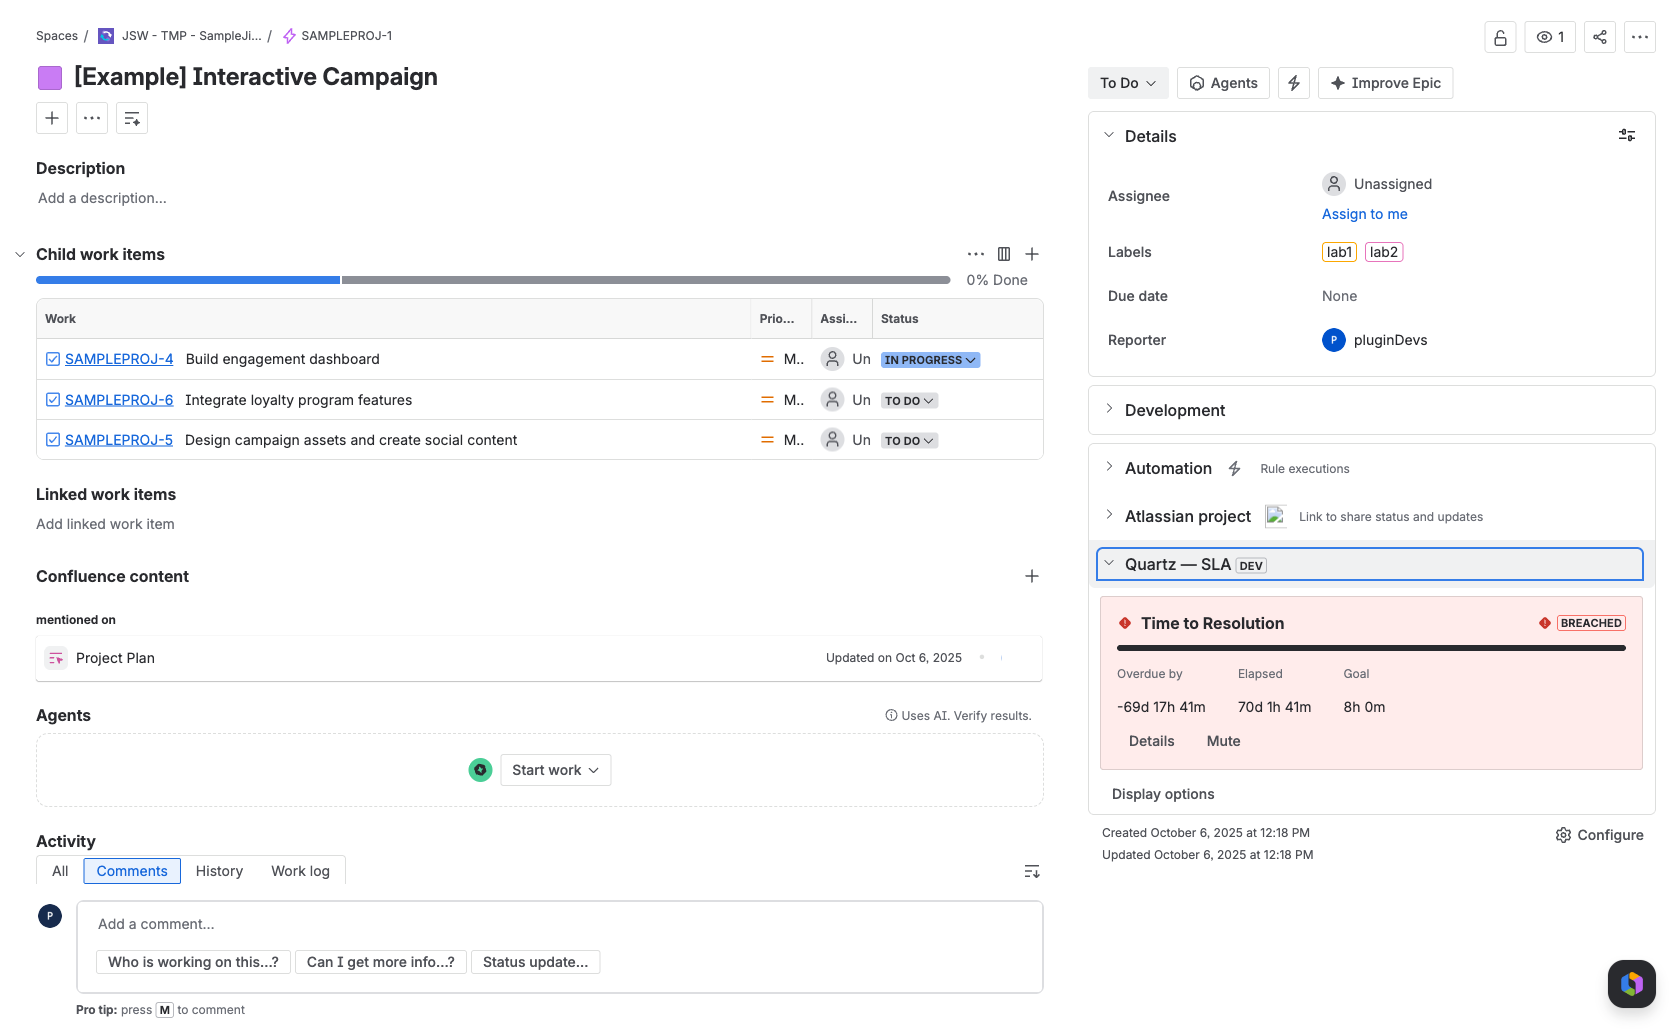
Each SLA goal on an issue carries a single status, shown as a colour-coded badge and a status spine alongside the progress bar. The status is not a stored flag — it is recomputed on demand, so it is always current and pause-aware. Nothing is backfilled or kept in a separate timer database.
A duration goal moves through its tiers as working time is consumed: it starts On track, crosses into At risk, then Critical, and finally Breached if the clock is still running past the target. A date-field goal compares now against the date taken from the issue, and a measure-only goal never breaches — it simply reports Measuring while open and Met once done.
Status legend
The full set of statuses Quartz can resolve, with the colour each uses across the issue panel, Radar and reports.
| Status | Colour | Meaning |
|---|---|---|
| On track | Green | Working time used is below the warning threshold; the goal is comfortably within budget. |
| At risk | Amber | Used time has passed the warning threshold (default 50% of the target) but not yet critical. |
| Critical | Orange / red | Used time has passed the critical threshold (default 80% of the target); breach is close. |
| Breached | Red | The clock ran past the target while the issue was still open. |
| Breached late | Red | The goal was met only after the target had already passed — resolved, but late. |
| Met | Green | The goal was completed within its target. |
| Measuring | Neutral | A measure-only goal that is still open; it tracks time but never breaches. |
| No target | Neutral | A date-field goal with no date available on the issue yet, so there is nothing to count down to. |
The warning and critical thresholds are the breach-distance bands for duration goals. They default to 50% (At risk) and 80% (Critical) of the target and are configurable per SLA when you edit it. See Create an SLA.
How "at risk" and time-remaining are derived
Both the status band and the time figures are driven by business-elapsed working time, not wall-clock time. Quartz projects elapsed time through the goal's working-hours calendar, so nights, weekends, holidays and closed exceptions are never counted. See Calendars & business hours for how that projection works.
Pause-aware time
If a pause condition holds — for example "waiting on customer" — that interval is excluded from the elapsed total and resumes automatically when the pause ends. The issue panel marks paused time as Paused — not counted, and the "Cycle breakdown" lists each working cycle and each pause interval, recomputed on demand every time.
Because of this, the same issue can sit open for days yet stay On track if most of that time was paused or outside business hours. The Remaining figure is what is left of the target after paused and non-business time are removed; once it goes negative, the panel shows Overdue by instead.
Where the bands fall
For a duration goal, Quartz takes the fraction of the target already consumed and maps it onto the bands: below the warning percentage it is On track, at or above it At risk, and at or above the critical percentage Critical. Once consumed time exceeds the target while the issue is still open, the goal is Breached.
If a goal looks healthier or worse than you expect, open Why this status? on the issue panel. It states in plain language when the clock started, what it is waiting for, how much pause time was excluded and the verdict — all recomputed on demand.
What counts as a breach
A breach means the clock ran past the goal's target. How that target is set depends on the SLA's target type:
| Target type | Breaches when |
|---|---|
| Duration | Business-elapsed working time exceeds the target minutes (which can vary by priority or JQL tier). |
| Date field | Now passes the date taken from an issue field. The due instant is the literal wall-clock field value, not projected through the calendar. |
| Measure-only | Never. It resolves to Met when done and Measuring while open. |
If the issue is resolved after the target had already passed, the outcome is Breached late rather than a still-running Breached — the promise was missed, but the work is done.
An auto-reply from an automation or app account does not satisfy a first-response goal if comment exclusion is configured — those comments are ignored by every clock. Status changes made by automation still count. Configure excluded actors in Settings.
Muted and extended goals
Two per-issue exceptions can change what a status means in the aggregate. Extend adds minutes to a single goal's target on one issue, shown as "+Xh extended" and clearable — useful when an exception genuinely warrants more time. Mute silences one goal on one issue: it is excluded from breach counts, the Radar, reports and the field write-back, but the panel still shows it flagged Muted so it can be unmuted. Mute is an exception, not a fix — the underlying breach is hidden from the numbers, not erased.
Both actions are recorded to the audit log and reviewed in Governance.
Where status shows
The same computed status surfaces in three places, each scoped to the issues you can browse.
On the issue panel
One tile per applicable goal, with the status badge, progress bar and Elapsed / Remaining (or Overdue by) / Goal figures. Includes the "Why this status?" explainer, the cycle breakdown, and a related-issues rollup showing the worst SLA status across the issue's subtasks, parent and linked issues.
On the Radar
Live status counts — On track / At risk / Critical / Breached — plus the "What breaches next" board, which buckets open at-risk issues by time-to-breach (overdue, next 8h, 24h, 48h, all), pause-aware and sorted by soonest breach. See Radar.
In reports
The per-issue grid carries an Outcome column (Met / Breached / At risk), and the KPI summary rolls statuses into Resolved / Met / Breached / Success rate. See Reports.
When a large aggregate scan cannot fully evaluate an issue's timing, that issue is counted "approximately" and the UI warns that pause time may be over-counted. The per-issue panel always uses the exact result.
Explain in plain words Advanced
On Advanced installs, each issue's SLA-detail modal offers ✦ Explain in plain words — a 2-3 sentence narrative of how the clock reached its status, covering the goal, worked time, pauses, cycles and start/pause conditions. It runs on Atlassian-hosted Claude, so prompts stay inside Atlassian.
Was this page helpful? Yes · No · Contact support