CSV export
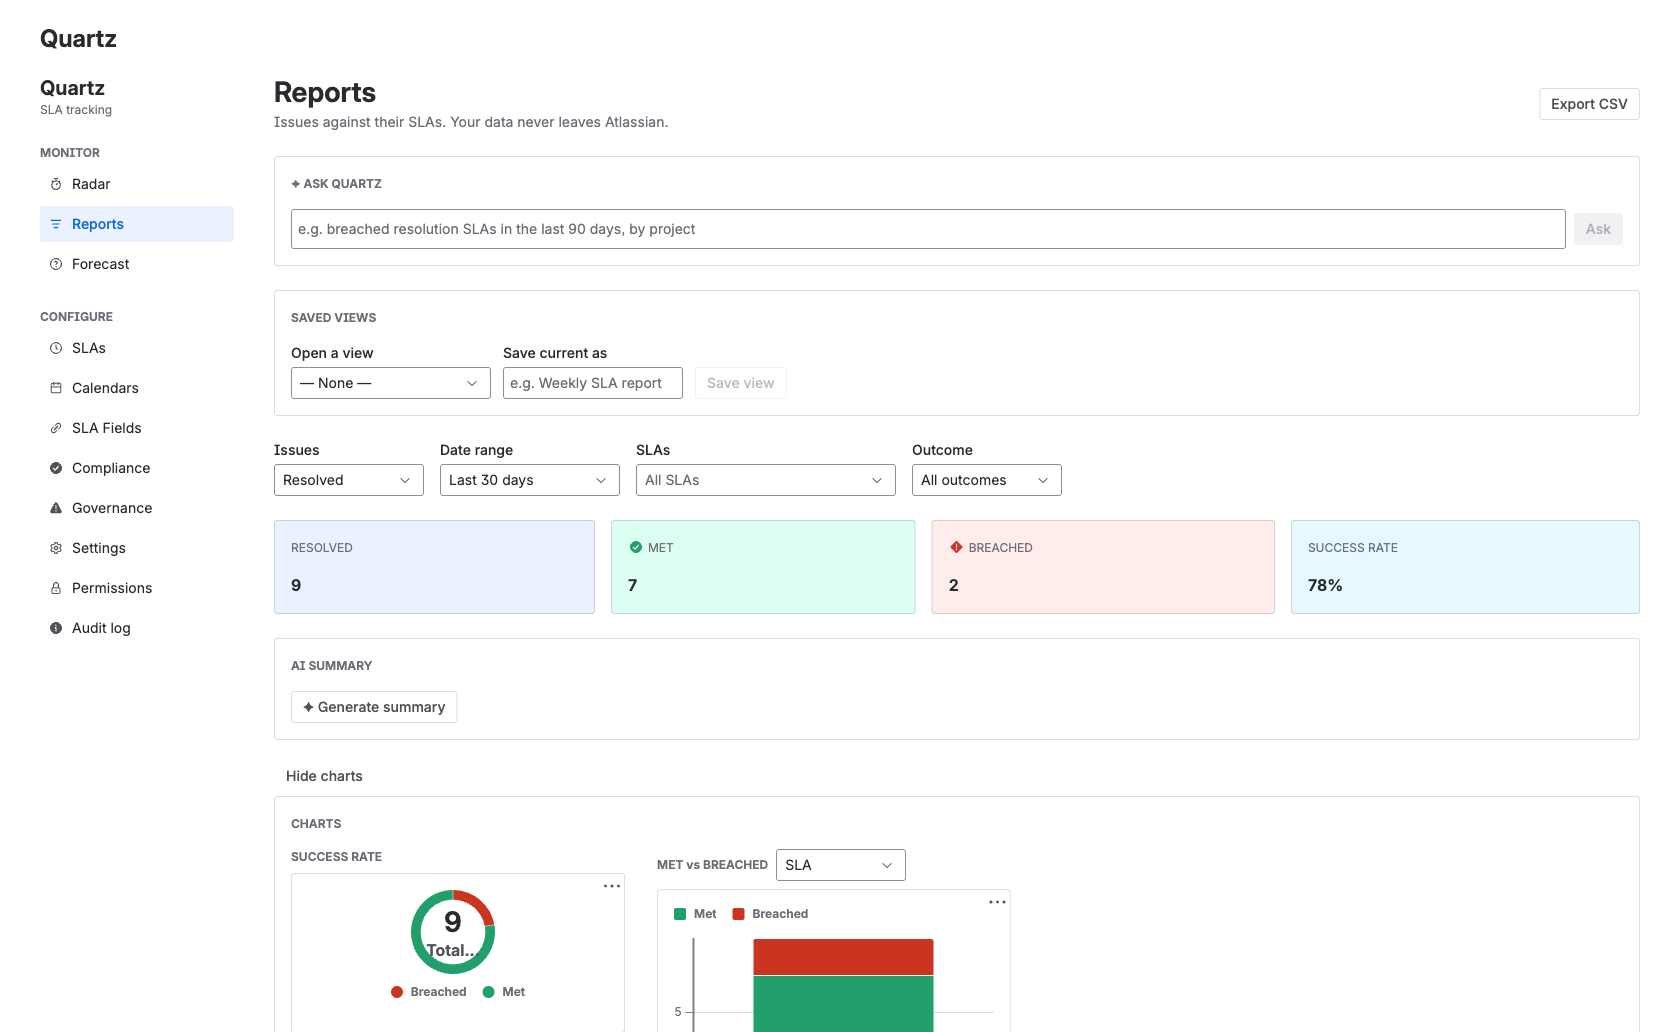
Export the rows you see in Reports to a CSV file — generated entirely in your browser, with no server round-trip and no data leaving Atlassian.
How it works
CSV export is part of the Reports page. When you click export, Quartz builds the file in your browser from the rows already on screen and triggers a download. There is no web trigger, no external server, and no egress — the data never goes anywhere your browser hasn't already loaded it.
The file is UTF-8 (with a byte-order mark so spreadsheets open it cleanly) and RFC-4180 quoted, so commas, quotes and line breaks inside a value are handled correctly.
If the runtime blocks the automatic download, Quartz falls back to a copy-paste code block containing the same CSV text, so you can always retrieve the data.
What gets exported
The export matches the visible, filtered rows exactly — what you have filtered, scoped and column-picked in Reports is what lands in the file. If you change the date range, scope, outcome filter or SLA selection, run the export again to reflect it.
Columns
The available columns mirror the Reports grid:
| Column | What it holds |
|---|---|
| Issue | The issue key |
| Summary | Issue summary |
| SLA | Which SLA goal the row is for |
| Outcome | Met, Breached or at-risk verdict |
| Priority | Issue priority |
| Assignee | Current assignee |
| Project | Project the issue belongs to |
| Created | Issue created date |
| Resolved | Issue resolved date |
| Target | The SLA goal (duration or due date) |
| Time taken | Business-hours working time used |
| Remaining | Time left against the goal |
Use the column picker in Reports to add or remove columns before exporting; the file includes only the columns you have shown.
Save a view in Reports for the exact filters and columns you export regularly, then re-run the export whenever you need a fresh file.
Typical uses
A CSV is the simplest way to take SLA outcomes outside the console without integrations:
| Use | Why CSV |
|---|---|
| Share | Send a snapshot to a stakeholder who doesn't have console access |
| Archive | Keep a point-in-time record of a reporting period |
| Pivot | Drop it into a spreadsheet for your own grouping, charts or pivot tables |
An export reflects what you can see. Reports is scoped to the issues you can browse in Jira, so the rows in your file are already limited to your visible issues — see Permissions.
Keeping data fresh in Jira
A CSV is a snapshot. If you need SLA values to stay live in Jira — for filters, dashboards or Automation — map them onto real Jira fields instead, where a scheduled sweep keeps them current. For a one-click narrative summary of a report, the AI report summary is available on Advanced.
Was this page helpful? Yes · No · Contact support