Reports & dashboards
Reports turn your live SLA timers into a filterable per-issue grid, KPI charts and a CSV export — all scoped to the issues you can browse, with optional Advanced AI extras.
What Reports show
The Reports screen is built around two things: a per-issue grid you can slice and a set of summary charts above it. Everything is computed on demand — nothing is stored or backfilled — so the figures always reflect the current state of your issues.
Every Reports view runs as you, so Jira filters the results to the issues you are allowed to browse. Two people opening the same report can see different totals. "Open by default" for Reports means everyone may open the screen — not that anyone sees issues they could not otherwise see.
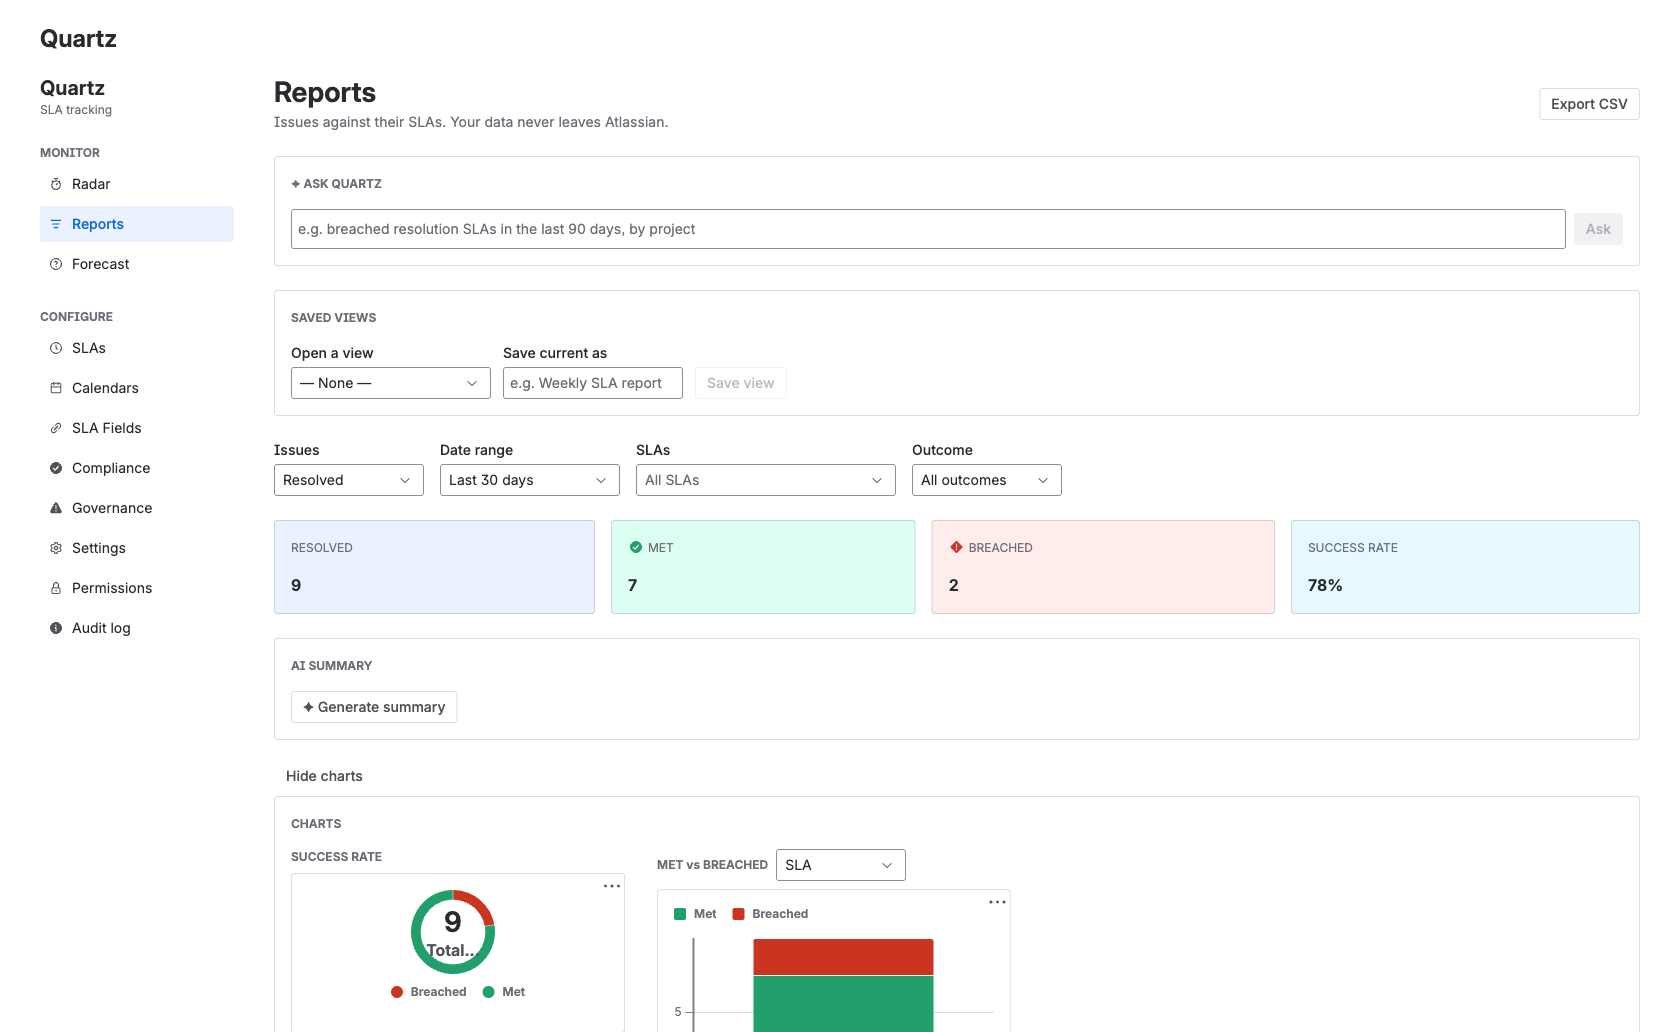
The per-issue grid
The grid lists one row per issue/SLA outcome with these columns: Issue, Summary, SLA, Outcome, Priority, Assignee, Project, Created, Resolved, Target, Time taken and Remaining. Use the column picker to choose which columns are visible.
Saved views
Once you have a filter set and column layout you like, save it as a view. Saved views are stored per user, so your views are yours alone and do not change what anyone else sees.
Filters and scope
Narrow the report with the filter bar above the grid. Filters apply to both the grid and the charts.
| Filter | Choices |
|---|---|
| Scope | Resolved, Open, or All |
| Date range | Last 7 / Last 30 / Last 90 days, or This month |
| Outcome | All, Met, Breached, or At risk |
| SLA | Multi-select one or more of your SLA definitions |
KPIs and charts
Above the grid, a KPI summary shows Resolved, Met, Breached and Success rate for the current filter. Alongside it are three charts:
Success-rate donut
The share of in-scope outcomes that were met versus breached.
Met-vs-breached bar
Met against breached counts, grouped by SLA, Assignee or Project.
Weekly trend line
How your outcomes move week over week across the selected range.
CSV export
Export the report to CSV at any time. The export matches the visible, filtered rows exactly — the same columns and the same filters you have applied.
The CSV is generated in your browser and downloaded directly — there is no server round-trip, so the data never leaves your machine through Quartz.
Jira dashboard gadget
Quartz ships a single Jira dashboard gadget, Quartz — SLA, that you add to any Jira dashboard. Its mode is chosen in the gadget's edit configuration:
| Mode | Shows |
|---|---|
| Health | A live status donut plus the top at-risk issues |
| Success rate | The met versus breached success rate |
| Met vs Breached | Met and breached counts, grouped |
| Trend over time | Outcomes over the selected range |
Each gadget is filterable by range, group-by and SLA selection. Like the Reports screen, the gadget is scoped to the viewer's browsable issues.
Advanced AI extras
Two optional AI helpers appear on the Reports screen with the Advanced edition. Both run on Atlassian-hosted Claude inside the Forge runtime, so prompts never leave Atlassian.
AI report summary
One click produces a short, plain-language executive summary of the report you are looking at — handy for sharing the headline with stakeholders without screenshots.
"Ask Quartz" natural-language query
Type what you want to see in plain language in the "✦ Ask Quartz" box, and Quartz sets the report filters for you — so you can explore without learning the filter controls.
On the Standard edition these two extras appear locked. All AI in Quartz is Advanced-only, and in production the Marketplace licence is the sole authority.
Where to go next
Was this page helpful? Yes · No · Contact support